
By James Eliot, Markets & Finance Editor
Last updated: May 07, 2026
5 Reasons Why Trading Dashboards Are Revolutionizing Investment Strategies
Sixty-eight percent of retail investors now use trading dashboards, a staggering 28 percentage points higher than just five years ago. This shift is not mere trend adoption; it signals a fundamental transformation in how individual investors analyze data and execute trades. While many view these dashboards as analytical tools, they are reshaping the investment landscape by democratizing access to advanced trading strategies once reserved for institutional giants.
What Is a Trading Dashboard?
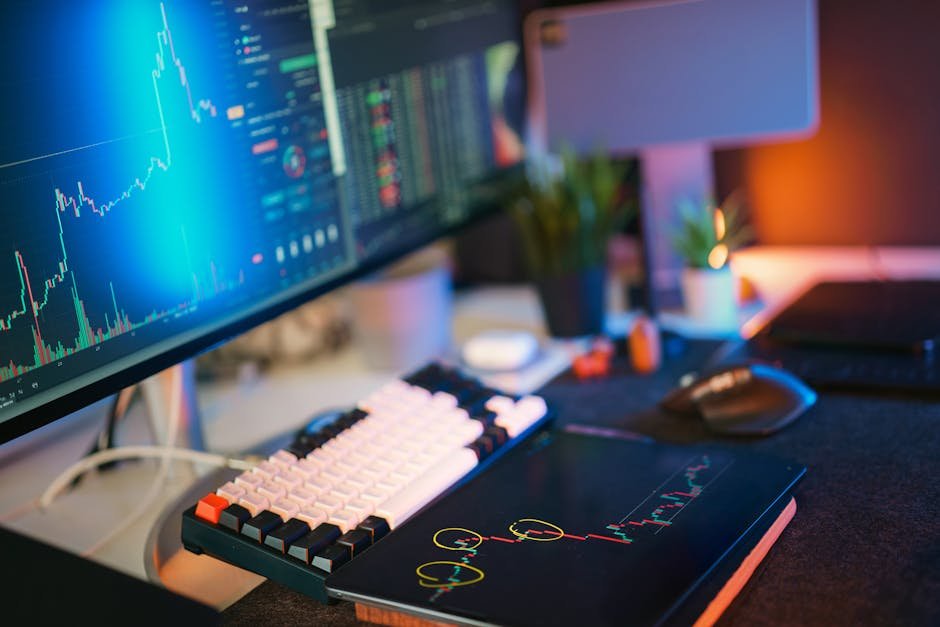
A trading dashboard is an integrated platform that aggregates market data, analytics, and visualization tools into a single interface, making it easier for investors to understand and act on financial trends. They are essential for both novice retail investors and seasoned traders, as they display real-time data in an intuitive format. Think of a trading dashboard as a digital cockpit, allowing you to monitor various financial instruments at a glance, much like a pilot manages flight data.
How Trading Dashboards Work in Practice
The rise of trading dashboards has allowed investors to leverage sophisticated data analytics much more efficiently. Here are some notable cases:
-
Firstrade: The user-friendly trading platform reported a 50% surge in its user base in 2022. The intuitive nature of its trading dashboard has lowered the barrier to entry for numerous retail investors, allowing them to participate more actively in market activities.
-
Robinhood: After integrating personalized dashboard features, the platform saw a 20% increase in trading volume. This enhancement not only boosted engagement but also kept users returning for frequent trading—a win-win for retention.
-
E*TRADE: The company reported a 45% rise in options trading directly linked to improved dashboard analytics. This encourages users to explore new financial strategies, illustrating how effective data visualization can enhance decision-making.
-
TradingView: This platform has attracted over 30 million users, establishing itself as a retail-friendly alternative to the premium Bloomberg Terminal. Users flock to TradingView for its customizable dashboards that allow for intricate market analyses, demonstrating the potential of user-driven design.
These examples underscore how trading dashboards facilitate not just engagement but also informed decision-making, replacing previous barriers that hindered retail investors’ ability to act on data.
Top Tools and Solutions
Investors looking to upgrade their trading experience can benefit from several highly-rated tools:
CloudTalk — Cloud-based business phone system ideal for remote teams seeking effective communication.
Databox — Business analytics and KPI dashboard platform for data-driven decision-making.
Morphy Mail — Powerful cold email delivery platform for sending to cold or purchased lists without spam filters.
Livestorm — Video engagement platform for webinars and meetings, facilitating seamless online communication.
Diginius — Digital marketing intelligence platform that empowers brands with actionable insights.
Uniqode — QR code generator and digital business card platform perfect for networking professionals.
Disclosure: Some links in this article may be affiliate links. We may earn a small commission at no extra cost to you. This does not influence our recommendations.
Common Mistakes and What to Avoid
While trading dashboards can empower users, several pitfalls exist:
-
Over-reliance on Data: A new investor using E*TRADE might mistakenly think that higher analytics alone guarantee successful trades. Ignoring fundamental analysis can lead to poor decision-making, as seen in many novice trading accounts that have underperformed.
-
Ignoring Market Sentiment: Users of platforms like Firstrade may base their trades solely on visual metrics without considering current events. The GameStop frenzy in early 2021 is a case in point, where many investors ignored news in favor of traditional technical indicators, leading to significant losses.
-
Poor Customization Practices: Investors on TradingView may neglect to customize dashboards according to their trading needs, resulting in overlooking critical data that could inform trades. Failure to personalize trading tools can diminish their effectiveness significantly.
These common missteps can derail investment strategies, revealing the importance of approaching dashboard utilization with informed diligence.
Where This Is Heading
The evolution of trading dashboards is likely to continue influencing the investment landscape markedly:
-
Increasing Integration with AI: Firms like Goldman Sachs foresee a robust increase in AI capabilities within trading dashboards by 2025. These advanced algorithms will likely assist users in making pre-emptive trading decisions based on predictive analytics.
-
Enhanced Collaboration Features: Expect a shift towards social trading functionalities where investors can share dashboards and insights, akin to social media. Trading platforms will reward community interaction as a means of engagement and retention.
-
Customization and Personalization: Research from the Federal Reserve indicates that as dashboards evolve, their customizability will become increasingly critical. By 2024, we can expect even more sophisticated tools tailored to specific investment styles and risk appetites; platforms that don’t adapt risk losing their user base.
For retail investors, these trends imply that honing market analysis skills will be crucial. As trading dashboards become ubiquitous and advanced, those who leverage these innovations will likely see substantial returns in the next 12 months.
FAQ
Q: What is a trading dashboard?
A: A trading dashboard is a platform that aggregates market data and analytics into a single interface, making it easier for users to analyze and execute trades. It’s crucial for both novice and seasoned investors to manage their investments effectively.
Q: How do trading dashboards benefit retail investors?
A: Trading dashboards provide real-time data and analytics, empowering retail investors to make informed decisions quickly. This essential tool helps them navigate the complex investment landscape.
Q: How do I choose the best trading dashboard?
A: Consider your investment goals, the types of assets you trade, and the features you need. Additionally, you may want to explore user reviews and compare pricing plans to find the best fit for your needs.
Q: What are the costs associated with trading dashboards?
A: The costs of trading dashboards vary widely based on features, subscription models, and trading platforms. Some offer free versions with limited functionality, while premium options can range from $10 to $300 or more per month.
Q: How can I effectively implement a trading dashboard?
A: To effectively implement a trading dashboard, start by familiarizing yourself with its main features, customize the layout and widgets to fit your trading style, and consistently review your analytics to adjust your strategies accordingly.
Q: What is a common mistake when using trading dashboards?
A: A common mistake is placing too much trust in the visuals and metrics without conducting thorough fundamental analysis. This can lead to misguided trading decisions and poor performance.
Q: Are trading dashboards a trend or the future of investing?
A: Trading dashboards are increasingly seen as the future of investing, integrating advanced analytics and AI to enhance trading strategies and democratize access to market data.
Q: What is the best tool for trading analytics?
A: The best tool often depends on individual needs and preferences, but platforms like TradingView and Databox are renowned for their user-friendly interfaces and powerful analytics features.